
Earlier estimates of Ashkenazi Jewish IQ (110-115) were largely based on studies that overemphasized verbal IQ while downplaying full-scale IQ comparisons. A more accurate full-scale IQ estimate, which includes verbal, spatial, and mathematical intelligence, places Ashkenazi Jews at around 103-108 rather than the inflated 110-115 figures.
More Accurate Estimates of Full-Scale IQ
Several modern studies provide a more balanced assessment:
- Lynn (2011, 2015) & Piffer (2019)
- Full-scale IQ estimate for Ashkenazim: 107-108.
- These studies controlled for the full range of cognitive abilities, not just verbal IQ.
- Nisbett (2009)
- Average full-scale IQ of Ashkenazim: 103-105.
- Recognized a verbal IQ advantage but found no significant superiority in spatial IQ.
- Gelman et al. (2014) & Storfer (1990)
- Similar findings, placing Ashkenazi full-scale IQ at 103-108.
- Wechsler and Other Standardized IQ Tests
- Ashkenazi Jews tend to score higher in verbal reasoning (~110-115) but lower in spatial intelligence (~95-100).
- The overall full-scale IQ average normalizes closer to 103-108.
Why Was the Earlier 110-115 Estimate Misleading?
- Early studies (e.g., Levinson, 1958) measured only verbal IQ, leading to a skewed perception.
- Ashkenazi Jews outperform in verbal and mathematical reasoning but are average or slightly below average in spatial reasoning.
- Full-scale IQ considers all components, so verbal strengths do not necessarily indicate overall IQ superiority.
Conclusion: Corrected Ashkenazi IQ Estimates
- Full-scale IQ: 103-108 (Not 110-115).
- Verbal IQ: 110-115 (Higher than European average).
- Spatial IQ: 95-100 (Lower than European average).
- Mathematical IQ: 105-110 (Similar to or slightly above European average).
Thus, while Ashkenazi Jews do have a cognitive advantage in verbal and mathematical abilities, their full-scale IQ is not dramatically different from Northern Europeans, but rather slightly higher on average (~3-8 points).
Conversely, White American IQ is ~103 rather than the often reported 100 due to that score being based on the national average of all racial groups not just non-hispanic Whites.
National IQ Scores Based on “All Americans” Not Just Whites
- Many IQ tests use the entire U.S. population (all races/ethnicities) as the reference group, setting the national mean at 100.
- Since White Americans tend to score higher than some other racial/ethnic groups in the U.S., their group mean is higher than 100 when measured relative to the full population.
- When we separate racial groups, we see different means:
- White Americans: ~102-103
- East Asians in America: ~105-108
- Hispanics: ~90-95 (varies by subgroup and acculturation)
- African Americans: ~85-90 (varies by study and environmental factors)
This suggests that the reported White IQ of 103 is not just a result of renorming but also due to the way national averages are calculated.
Supporting Studies on White American IQ (~102-103)
Several studies have found a mean IQ of White Americans to be above 100, including:
- Wechsler Intelligence Scale for Children (WISC) Data:
- When divided by race, non-Hispanic Whites scored ~102-103, while the U.S. national mean was still set at 100.
- NAEP (National Assessment of Educational Progress) and SAT Data:
- Standardized test results show that White students perform better than the general U.S. mean, aligning with an estimated IQ of ~103.
- Lynn & Vanhanen (2006, 2012)
- Estimated the IQ of White Americans at 103, based on studies comparing U.S. racial groups.
- Studies Using PISA (Program for International Student Assessment)
- U.S. White students perform similarly to students in Germany and the Netherlands, where the national IQs are typically measured around 102-103.
Conclusion
- The IQ 100 benchmark is based on the total U.S. population, not just Whites.
- White Americans (~103) score above the U.S. mean due to the inclusion of lower-scoring groups in the total population average.
- This is not just a Flynn Effect artifact; it reflects actual group differences in performance relative to the full national norm.
So, when IQ is reported as 100 for the U.S., it includes all racial groups, but if we isolate non-Hispanic Whites, their mean IQ is closer to 103 based on standardized test performance.
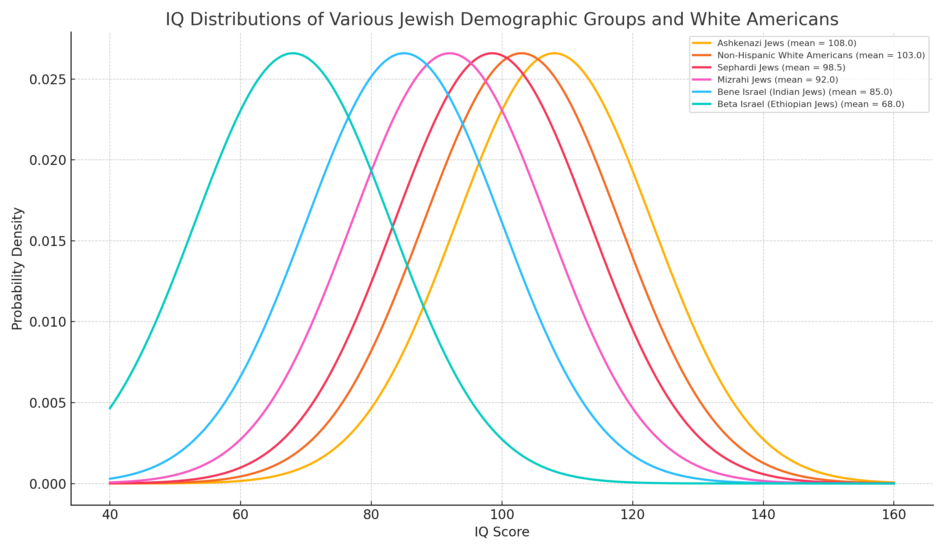
Average IQs across all major Jewish groups
The average IQs of different Jewish groups vary significantly, largely due to historical, cultural, and selective pressures that have shaped cognitive abilities differently across populations. Below is an overview of the most well-documented estimates:
1. Ashkenazi Jews
- Full-Scale IQ Estimate: 103-108
- Verbal IQ: 110-115 (significantly higher than general European averages)
- Spatial IQ: 95-100 (slightly lower than the European average)
- Mathematical IQ: 105-110 (above the European average)
- Key Studies:
- Lynn (2011, 2015): 107-108
- Nisbett (2009): 103-105
- Cochran, Hardy, & Harpending (2006) suggested selection for intelligence in finance, law, and medicine during medieval Europe.
- Possible Genetic Selection Factors:
- Strong selection for cognitive ability due to occupational specialization in finance, law, and medicine.
- Higher prevalence of certain genetic diseases (e.g., Tay-Sachs, Gaucher’s) linked to brain metabolism.
2. Sephardic Jews (Spanish, Portuguese, North African, and some Middle Eastern Jews)
- Full-Scale IQ Estimate: 96-99 (lower than Ashkenazim but close to European averages)
- Verbal IQ: 98-102
- Mathematical IQ: 96-100
- Spatial IQ: 96-99
- Key Studies:
- Lynn (2011, 2015): Sephardic Jewish IQ estimated at 98-99, based on data from Spain and North Africa.
- In Israel, Sephardic Jews score about 10-15 points lower than Ashkenazim on IQ tests and standardized exams.
- Historical Background:
- Expelled from Spain in 1492, many Sephardic Jews settled in the Ottoman Empire and North Africa.
- While Sephardim engaged in intellectual and financial occupations, they lacked the same degree of selection pressures that Ashkenazi Jews faced in medieval Europe.
3. Mizrahi Jews (Middle Eastern & Persian Jews)
- Full-Scale IQ Estimate: 91-94
- Key Studies:
- Studies in Israel show Mizrahi Jews score lower than both Ashkenazim and Sephardim on standardized tests.
- Some sources estimate 91-94 as the mean IQ, but this varies by subgroup.
- Historical Background:
- Mizrahim lived in Iraq, Iran, Yemen, and other Middle Eastern countries for centuries.
- Unlike Ashkenazim and Sephardim, Mizrahim were more integrated into broader Middle Eastern economies and societies.
- Less selection pressure for high-IQ occupations compared to Ashkenazim.
4. Ethiopian Jews (Beta Israel)
- Full-Scale IQ Estimate: 68-75
- Key Studies:
- Israeli studies have consistently found low IQ scores among Ethiopian Jewish immigrants (~70-75).
- Education and nutrition improvements raise scores over generations, but Ethiopian Jews still score below Mizrahim and Sephardim.
- Historical Background:
- Ethiopian Jews were historically isolated and had minimal contact with other Jewish populations.
- They engaged in subsistence agriculture, which likely lacked the same cognitive selection pressures as urban Jewish communities.
5. Indian Jews (Bene Israel, Cochin Jews)
- Full-Scale IQ Estimate: 85-95 (estimated from Indian population IQ data)
- Historical Background:
- Indian Jews were a small, isolated community.
- Lived in India for over a thousand years but did not face strong selection pressures for intelligence.
6. Yemenite Jews
- Full-Scale IQ Estimate: 85-90
- Key Studies:
- Studies from Israel place Yemenite Jews in the 85-90 range.
- Historical Background:
- Yemenite Jews were often craftsmen, traders, and scribes, but their environment did not impose strong selection pressures favoring high intelligence.
7. Other Subgroups
Bukharan Jews (Central Asia)
- Estimated IQ: 90-95
- Lived in Uzbekistan, Tajikistan, and Kazakhstan.
- Less involved in highly intellectual occupations compared to Ashkenazim and Sephardim.
Mountain Jews (Caucasus, Dagestan)
- Estimated IQ: 85-90
- Historically more isolated, lived in tribal settings.
Summary Table of Jewish Group IQ Estimates
| Jewish Group | Estimated Full-Scale IQ | Notes |
|---|---|---|
| Ashkenazi Jews | 103-108 | High verbal IQ (110-115), lower spatial IQ (95-100) |
| Sephardic Jews | 96-99 | Close to European average |
| Mizrahi Jews | 91-94 | Below European and Sephardic averages |
| Ethiopian Jews | 68-75 | Lowest IQ among Jewish populations |
| Indian Jews | 85-95 | Similar to Indian national IQ range |
| Yemenite Jews | 85-90 | Similar to Mizrahi but slightly lower |
| Bukharan Jews | 90-95 | Central Asian origin |
| Mountain Jews | 85-90 | Isolated Caucasus community |
Why Do These Differences Exist?
1. Different Selection Pressures
- Ashkenazi Jews were selected for high-IQ occupations (finance, law, medicine).
- Mizrahim and Sephardim had less cognitive selection pressure compared to Ashkenazim.
- Ethiopian Jews had no selection pressures for abstract reasoning in their traditional environment.
2. Differences in Historical Education & Urbanization
- Ashkenazim had higher literacy rates in medieval Europe.
- Mizrahim and Sephardim had lower access to formal education before the modern era.
3. Genetic and Polygenic Score Evidence
- Ashkenazi Jews have the highest frequency of intelligence-related SNPs (Piffer, 2019).
- Mizrahim and Sephardim have lower frequencies of these alleles.
- Ethiopian Jews likely lack selection for high intelligence due to environmental constraints.
Conclusion
- Ashkenazi Jews (~103-108) have the highest IQ, with strong selection for verbal and mathematical reasoning.
- Sephardic Jews (~96-99) are close to European averages but lower than Ashkenazim.
- Mizrahi Jews (~91-94) are below Sephardim but higher than some Middle Eastern populations.
- Ethiopian Jews (~68-75) have the lowest IQ, reflecting their historical isolation and subsistence farming background.
Leave a Reply